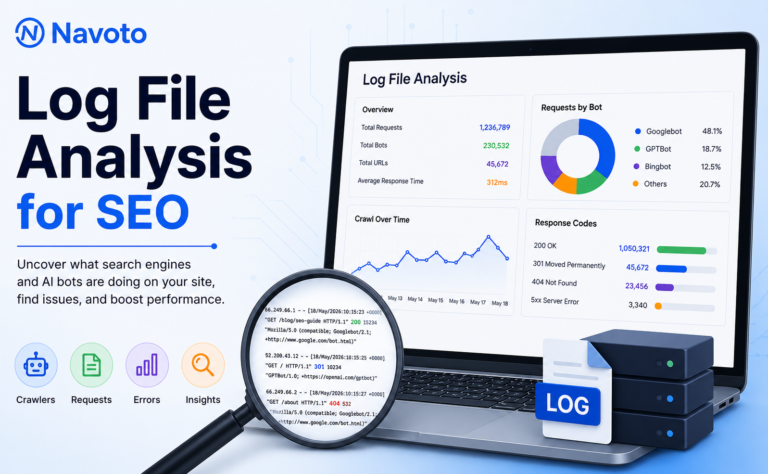
Google Search Console will tell you what Google says it’s doing on your site. Your log files tell you what’s actually happening — every bot, every status code, every wasted crawl, timestamped and unfiltered. This guide covers what log file analysis is, why it matters even more now that GPTBot, ClaudeBot, and PerplexityBot are crawling alongside Googlebot, and exactly how to run one using Screaming Frog’s Log File Analyser, step by step.
What Is Log File Analysis?
Log file analysis is the process of downloading your web server’s access logs and reviewing them to see exactly which pages search engine and AI crawlers requested, when they requested them, and what your server returned. It’s the only source of data that shows real crawler behavior rather than an estimate or a sample of it.
Every time anything — a person, Googlebot, GPTBot, a broken link checker — requests a page from your server, that request gets written to a log file as a single line: a timestamp, an IP address, the URL requested, the user-agent string, and the HTTP status code your server sent back. A busy site generates millions of these lines a day. Log file analysis is simply the practice of pulling out the lines that matter for SEO — the crawler requests — and turning them into answers to specific questions: is Googlebot finding my new pages quickly, is it wasting time on pages I don’t care about, and are there errors it’s hitting that I don’t know about yet.
This is one of the two “core” technical checks behind our Hybrid Engine Optimization framework — after confirming your robots.txt isn’t accidentally blocking crawlers, reviewing your crawl logs is the next step, because it tells you what bots are actually doing on your site rather than what you assume they’re doing.
Why Log File Analysis Matters More in 2026
Log file analysis used to be a niche, mostly-enterprise practice reserved for sites with millions of pages worried about crawl budget. Two things changed that:
AI crawlers are now a major share of your traffic. GPTBot, ClaudeBot, PerplexityBot, Amazonbot, and CCBot crawl the web constantly to power AI answers and citations, and in competitive verticals, AI bot activity now accounts for a meaningful share — sometimes 15–25% — of total server requests on top of traditional search crawlers. Google Search Console shows you none of this. It only reports on Google’s own crawlers, which means log files are currently the only reliable way to see whether AI platforms are even reaching your content, a gap we cover from the monitoring side in our guide to AI search monitoring platforms.
Sites are bigger and more dynamic than ever. Faceted navigation, programmatic pages, and CMS-generated parameter URLs mean modern sites often have far more crawlable surface area than a sitemap suggests — and every one of those extra URLs competes for the same finite crawl budget as your actual money pages.
The upshot: in 2026, log file analysis isn’t just a crawl-budget exercise for enterprise sites anymore, it’s the clearest window into whether your site is even reachable by the systems — human search and AI search alike — that decide what gets discovered.
Log Files vs. Google Search Console Crawl Stats
Google Search Console’s Crawl Stats report is a genuinely useful free tool, and it’s worth checking regularly. But it isn’t a substitute for log files — it’s a summary, and summaries hide the details that actually matter.
| Factor | GSC Crawl Stats | Raw Log Files |
|---|---|---|
| Crawlers covered | Google only | Every bot that hits your server, including AI crawlers |
| Data granularity | Aggregated, sampled | Every single request, unsampled |
| Lookback window | 90 days | Whatever your server retains (often just 7–30 days by default) |
| URL-level detail | Limited drill-down | Full detail on every single URL |
| Cost | Free | Free to access; tools to analyze range from free to paid |
The practical takeaway: use GSC as an early-warning dashboard, and use log files when you need to actually diagnose what’s going on underneath the summary.
How to Get Your Log Files
This step trips up more people than the analysis itself. Where to look depends on your setup:
- Shared hosting / cPanel: log into cPanel, find the “Raw Access Logs” or “Metrics” section, and download the most recent file — usually named something like
access.logor found in a folder calledlogsoraccess_logs. - VPS or dedicated server: connect via an FTP/SFTP client like FileZilla, or SSH directly in, and pull the logs from your web server’s log directory (commonly
/var/log/apache2/or/var/log/nginx/). - No server access: ask your developer or hosting provider directly for the logs — this is genuinely the most common bottleneck in log file analysis, and it’s worth setting up a recurring export so you’re not requesting it manually every time.
- Behind a CDN (Cloudflare, Akamai, Fastly): your origin server logs may only capture cached-miss traffic. You’ll usually need to enable the CDN’s own logging or log-push feature to see the full picture of what’s hitting the edge.
Don’t wait to grab them. Most servers only retain raw logs for 7–30 days by default before they’re rotated out or deleted. Set up an automated monthly export or backup as soon as you know you’ll need historical data.
Screaming Frog Log File Analyser: Full Walkthrough
Screaming Frog’s Log File Analyser is the tool most SEOs reach for first, and for good reason — it’s purpose-built for this exact job rather than a general log tool repurposed for SEO. Here’s what it is and how to actually use it.
What it is and what it costs
It’s a desktop application for Windows, Mac, and Linux that you install locally — nothing uploads to a third-party server, which matters for sites with sensitive traffic data. The free version analyzes up to 1,000 log events in a single project, which is enough to test whether your log format is supported before committing. A full licence costs $139 per year, which removes the event cap and lets you save multiple projects. Notably, the “Imported URL Data” feature — matching a separate data source like a site crawl against your log data — is unlimited even in the free version.
Supported log formats
It natively parses Apache and W3C Extended formats (which covers Apache, IIS, and NGINX servers), Amazon Elastic Load Balancing’s custom format, JSON line-delimited logs, and HAProxy logs. If your log has an unusual custom structure, the tool lets you preview and manually map fields during import rather than failing silently.
Step 1: Create a project and import
Open the app, click “New,” name your project, and set the correct timezone — this matters for matching crawl timestamps accurately later. Then drag and drop your raw log file (or files) directly onto the interface. The tool auto-detects the format and starts processing; large files are stored in a local database rather than held in memory, so it can handle millions of lines without choking.
Step 2: Verify your bots
Tick “Verify Bots When Importing Logs” during setup. Bot user-agents are trivially easy to fake, so this option performs a reverse DNS/IP lookup against publicly confirmed ranges to confirm a request claiming to be Googlebot is actually coming from Google. It slows down import slightly, but skipping it means your entire analysis could be built on spoofed traffic.
Step 3: Read the Overview tab
This is your dashboard: total events, unique URLs crawled, average response time, average bytes per request, and a timeline chart of crawl activity. Use the date range and user-agent dropdowns to isolate a specific bot or period — this is usually the fastest way to spot an obvious spike or sudden drop worth investigating further.
Step 4: Filter by user-agent, including AI bots
The tool ships with presets for major AI platforms alongside traditional search bots, so you can isolate GPTBot, ClaudeBot, PerplexityBot, Amazonbot, and others specifically. This is where you answer the 2026-specific question GSC can’t: which AI systems are actually crawling your site, and which pages are they prioritizing.
Step 5: Cross-reference with a real crawl
This is the single most valuable technique in the tool, and the one most beginners skip. Export the “Internal” tab from a Screaming Frog SEO Spider crawl of your site, then drag that export into the “Imported URL Data” tab. The tool automatically matches URLs across both data sets, unlocking three critical views in the URLs and Response Codes tabs:
- Matched With URL Data — pages that appear in both your crawl and your logs, so you can see crawl data and site data side by side.
- Not In URL Data — pages bots are requesting that didn’t turn up in your crawl. These are usually orphan pages, old URLs still holding backlinks, or stale redirects.
- Not In Log File — pages that exist on your site and were crawled by you, but that bots have never requested. These are your invisible pages.
Step 6: Check Response Codes
Sort this tab by status code to surface every 4xx and 5xx a bot has hit, plus redirect chains (3xx) and any URL returning inconsistent codes over time — a page that’s sometimes 200 and sometimes 500 is a red flag worth investigating on the server side, not just the SEO side.
A small but genuinely useful detail buried in the tool: it will also estimate the carbon footprint of your crawled log data if you enable the option during project setup — a nice touch for teams reporting on sustainability alongside SEO metrics.
If you’d rather see how the Log File Analyser stacks up against the rest of a technical SEO toolkit — including Screaming Frog’s separate SEO Spider crawler — our full breakdown of the best SEO tools in 2026 covers where each one fits and what it costs.
7 Things to Look For in Your Log Data
A Repeatable Log File Analysis Workflow
Treat this as an ongoing habit, not a one-time project:
- Pull a fresh log export covering at least the last 30 days (3 months if you’re investigating a longer trend, 6–12 months for migration or seasonal analysis).
- Filter to bots only and verify them, stripping out human traffic, asset requests, and unverified crawlers claiming to be search engines.
- Cross-reference against a fresh site crawl to surface orphan pages and invisible pages, as covered above.
- Prioritize by impact — a batch of 404s on old blog tags matters far less than a redirect chain on your core product pages.
- Fix, then re-check in the next log pull to confirm crawl behavior actually changed, not just that the fix was deployed.
If this is the first technical review you’ve done on the site, it’s worth pairing it with a full professional technical SEO audit rather than working from log data in isolation — logs tell you what’s happening, but an audit tells you why, and gives you a prioritized plan instead of a pile of data.
Common Mistakes to Avoid
- Not verifying bots. A meaningful share of “Googlebot” traffic in raw logs is spoofed. Skipping verification means building conclusions on fake data.
- Analyzing logs in isolation. Without cross-referencing against a real crawl, you can’t tell an orphan page from a page that’s simply new.
- Treating it as a one-off. Crawl behavior shifts as your site changes. A single snapshot goes stale within weeks.
- Ignoring AI bots entirely. Sites optimizing only for Googlebot are increasingly blind to a growing share of how their content is actually being consumed and cited — a gap covered further in our piece on how AI agents read and navigate websites.
- Not acting on the data. Log file analysis is diagnostic, not decorative — every finding should map to a fix, tracked against your broader strategic SEO plan.
Key Stats for 2026
15–25%
Share of total server requests that can come from AI bots in competitive verticals
90 days
Maximum lookback in GSC’s Crawl Stats report — and Google-only
7–30 days
Typical default log retention window before rotation or deletion
$139/yr
Cost to unlock unlimited events in Screaming Frog’s Log File Analyser
Figures are directional 2025–2026 industry observations compiled from multiple technical SEO sources and vendor documentation; exact numbers vary by site, hosting setup, and vendor pricing changes.
Alternatives to Screaming Frog
Screaming Frog covers the vast majority of use cases well, but a few alternatives are worth knowing about depending on scale and budget: Semrush’s Log File Analyzer is a solid cloud-based option if you’re already inside the Semrush ecosystem and want something with less setup than a desktop tool. JetOctopus and Botify are enterprise-grade platforms built for sites with tens of millions of URLs, with automated cloud ingestion and BigQuery-style analysis. OnCrawl sits in between, pairing log analysis with its own crawler for mid-to-large sites. For most small-to-mid-sized sites, Screaming Frog’s combination of price, local data privacy, and depth of feature set remains the practical default — a view we go into more in our 2026 SEO tools guide.
Frequently Asked Questions
What’s the difference between log files and Google Search Console’s Crawl Stats?
Crawl Stats is a sampled, aggregated summary covering only Google’s own crawlers over the last 90 days. Log files are the complete, unfiltered record of every request from every bot, for as long as your server retains them.
Do I need Screaming Frog specifically, or can I analyze logs another way?
No single tool is required — technically-minded teams can parse logs with Python or load them into a spreadsheet for smaller files. Screaming Frog’s Log File Analyser is simply purpose-built for SEO use cases and removes most of the manual parsing work.
How often should I run log file analysis?
Monthly is a reasonable baseline for most sites, with a deeper review after any major migration, redesign, or sudden ranking or indexing change.
Do log files record real visitors too, or only bots?
Both. Every request is logged regardless of source. For SEO analysis, you typically filter down to verified crawler user-agents and set the rest aside.
Is log file analysis worth doing for a small website?
Crawl budget itself matters less for small sites, but log files are still one of the fastest ways to catch silent errors, orphan pages, and — increasingly — to see whether AI bots are reaching your content at all.
How do I get log files if I’m on shared hosting or behind a CDN?
Check cPanel’s raw access logs section first. If that’s unavailable or incomplete, ask your host or developer directly, and if you’re behind a CDN, enable its log-push or logging feature so you capture traffic hitting the edge, not just your origin server.
Not sure what your log files are telling you?
Navoto runs full technical SEO audits — including log file and crawl budget analysis — as part of our organic SEO services, so you get a prioritized fix list, not just raw data.