Google Ads performance varies dramatically by campaign type, industry, and optimization strategy. In 2026, the average click-through rate (CTR) for Google Search Ads is 3.17%, while Display Ads average just 0.46%. Understanding these benchmarks helps advertisers set realistic goals and identify optimization opportunities.
This guide provides current Google Ads benchmarks across all campaign types, explains what drives performance differences, and delivers actionable optimization strategies based on 2026 data.
Google Search Ads Benchmarks 2026
Current Performance Metrics
| Metric | Average Range | Top Performers |
|---|---|---|
| Click-Through Rate (CTR) | 2.8% – 3.5% | 6% – 12% |
| Cost Per Click (CPC) | $1.50 – $4.20 | $0.80 – $2.00 |
| Conversion Rate | 4.2% – 5.8% | 10% – 15% |
| Cost Per Acquisition (CPA) | $35 – $85 | $15 – $40 |
Industry Variations:
- Legal services: CPC $8-$15, CTR 3.5-4.2%
- E-commerce: CPC $0.90-$2.50, CTR 2.5-3.8%
- B2B services: CPC $3.50-$7.00, CTR 2.2-3.0%
- Healthcare: CPC $2.80-$5.50, CTR 3.0-4.5%
What Affects Search Ads Performance
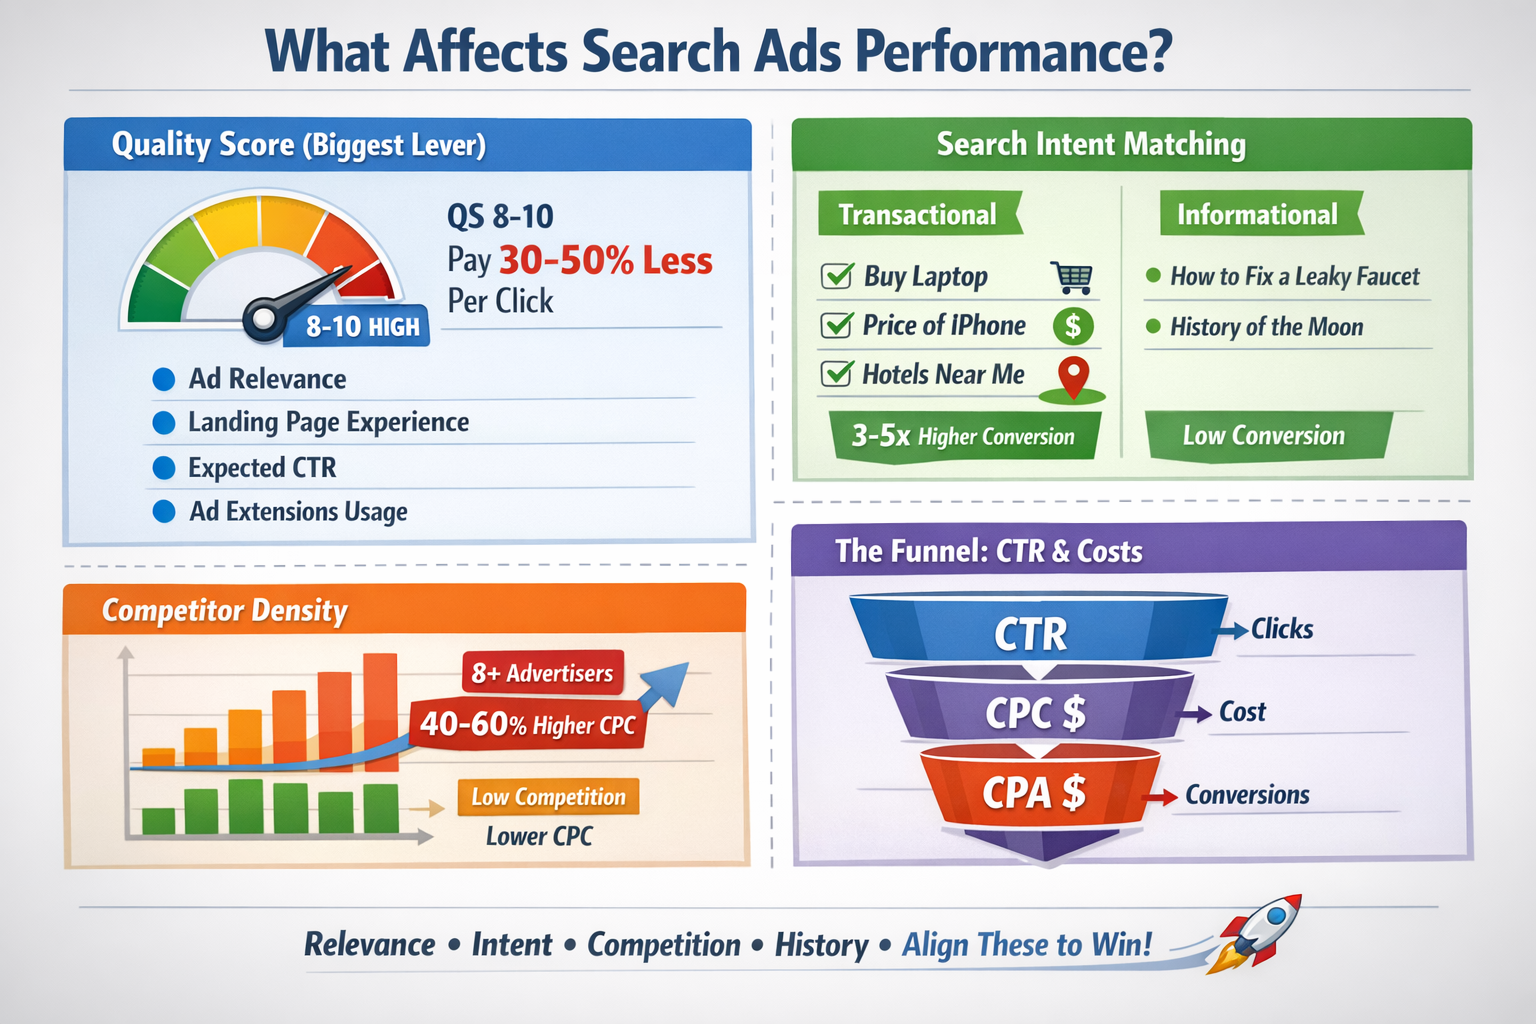
Quality Score remains the dominant factor. Accounts with Quality Scores of 8-10 pay 30-50% less per click than those with scores of 4-6. The algorithm prioritizes:
- Ad relevance to search query: Exact match keywords typically achieve 15-25% higher CTRs than broad match
- Landing page experience: Pages loading under 2 seconds convert 35% better than slower pages
- Expected CTR: Historical account performance creates momentum that’s difficult to reverse
- Ad extensions usage: Ads with 4+ extensions see 20-30% CTR improvements
Search intent matching separates winning campaigns from mediocre ones. Transactional queries (“buy,” “price,” “near me”) convert 3-5x higher than informational searches.
Competitor density directly impacts CPC. Markets with 8+ active advertisers see CPCs 40-60% higher than less competitive niches.
Common Search Ads Mistakes

Want to avoid wasting ad spend? Check out common Search Ads mistakes that silently kill CTR and conversions.
Single Keyword Ad Groups (SKAGs) are outdated. Google’s AI now prefers themed ad groups with 5-15 related keywords, allowing the algorithm to find conversion patterns across semantic variations.
Ignoring search term reports wastes 15-30% of budgets on irrelevant clicks. Weekly reviews should identify and exclude non-converting queries.
Generic ad copy kills CTR. Ads without specific numbers, unique value propositions, or emotional triggers achieve 40-60% lower engagement than personalized variants.
Broad match without conversion tracking is financial suicide. Broad match works brilliantly with Smart Bidding strategies but requires accurate conversion data to train the algorithm.
Manual bidding in 2026 leaves money on the table. Target CPA and Target ROAS strategies outperform manual bidding by 20-35% for accounts with 30+ monthly conversions.
Search Ads Optimization Steps
Struggling with low ROAS from Google Shopping ads? This complete Google ads optimization guide shows exactly how to improve product feed optimization, fix poor campaign structure, reduce wasted ad spend, and scale profitable Shopping campaigns step by step.
1: Restructure for Quality Score
- Create tightly themed ad groups with 5-10 keywords maximum
- Write 3-4 responsive search ads per ad group using all 15 headline slots
- Include your primary keyword in at least 2 headlines and 1 description
- Add all relevant extensions: sitelinks, callouts, structured snippets, call extensions
2: Implement Advanced Audience Layering
- Add first-party data audiences (website visitors, customer lists)
- Apply demographic bid adjustments based on conversion data
- Use in-market and affinity audiences for observation, not targeting
- Create custom segments based on search behavior and interests
3: Landing Page Optimization
- Match headline messaging between ads and landing pages exactly
- Reduce page load time to under 2 seconds using image compression and lazy loading
- Place conversion elements (forms, buttons) above the fold
- A/B test headline variations, form length, and CTA button colors
4: Adopt Smart Bidding Strategies
- Switch to Target CPA once you have 30+ conversions in 30 days
- Use Target ROAS for e-commerce with transaction value tracking
- Enable Maximize Conversions for new campaigns during learning phase
- Set portfolio bid strategies across similar campaigns for faster learning
5: Weekly Optimization Routine
- Review search terms and add negatives (spend at least 15 minutes here)
- Adjust bids on top-performing audience segments (+10-30%)
- Pause keywords with 0 conversions after 100+ clicks
- Test new ad copy variations focusing on emotional triggers and specificity
Shopping Ads Benchmarks 2026
Current Performance Metrics
| Metric | Average Range | Top Performers |
|---|---|---|
| Click-Through Rate (CTR) | 0.85% – 1.2% | 2.5% – 4.0% |
| Cost Per Click (CPC) | $0.60 – $1.40 | $0.30 – $0.80 |
| Conversion Rate | 1.8% – 2.5% | 4.5% – 7.0% |
| Cost Per Acquisition (CPA) | $25 – $60 | $12 – $28 |
Product Category Variations:
- Electronics: CPC $0.80-$1.80, Conversion Rate 2.0-3.2%
- Fashion/Apparel: CPC $0.40-$0.95, Conversion Rate 1.5-2.8%
- Home & Garden: CPC $0.55-$1.20, Conversion Rate 2.2-3.5%
- Sports & Outdoors: CPC $0.65-$1.35, Conversion Rate 1.9-2.9%
What Affects Shopping Ads Performance
Product feed quality determines visibility and CTR. Google’s algorithm prioritizes feeds with:
- Complete product titles (100-150 characters with brand, product type, color, size, key features)
- High-quality images (minimum 800×800 pixels, white or contextual backgrounds)
- Detailed product descriptions (500+ characters with specifications and benefits)
- Accurate GTINs, MPNs, and brand attributes for all applicable products
Pricing competitiveness is make-or-break. Products priced 10-15% above market average see 60-70% fewer impressions regardless of other factors.
Product ratings and reviews boost CTR by 25-40%. Products with 4+ star ratings and 10+ reviews dramatically outperform those without social proof.
Inventory turnover affects campaign learning. Products with consistent sales history get preferential treatment from the algorithm.
Common Shopping Ads Mistakes
Incomplete product feeds handicap campaigns before they start. Missing product_type, google_product_category, or custom_label attributes prevents effective segmentation.
No negative keywords in Shopping campaigns allows irrelevant searches. Even product-based campaigns need 50-100 negatives to eliminate waste.
Bidding the same for all products ignores profitability differences. High-margin items deserve higher bids; loss leaders need conservative spending.
Ignoring mobile optimization costs conversions. 65% of Shopping clicks happen on mobile, but many stores provide poor mobile experiences.
Static product titles miss seasonal and trending opportunities. Top performers update titles monthly with trending search terms.
Shopping Ads Optimization Steps
1: Master Product Feed Optimization
- Use all 150 characters in product titles: [Brand] + [Product Type] + [Key Features] + [Color] + [Size/Model]
- Add custom_label fields for margin, bestseller status, seasonal products, and clearance items
- Include all optional attributes: material, pattern, age_group, gender, size_type
- Update prices daily to maintain competitive positioning
- Add product_type hierarchy with 3-5 levels for granular campaign organization
2: Create Strategic Campaign Structures
- Build separate campaigns for high-margin vs. low-margin products
- Create brand-specific campaigns for branded search traffic
- Segment by product performance (bestsellers, new arrivals, clearance)
- Use Standard Shopping for brand campaigns, Performance Max for generic traffic
- Set up catchall campaigns with low bids to capture remaining traffic
3: Implement Priority Bidding
- Use campaign priorities (Low/Medium/High) to control traffic distribution
- High priority + low bids for brand campaigns (capture cheap brand clicks)
- Medium priority + competitive bids for bestsellers
- Low priority + aggressive bids for generic terms
- Add negative keywords to higher-priority campaigns to force traffic down to better campaigns
4: Optimize Product Images and Content
- Use lifestyle images showing products in context (increases CTR 30-40%)
- Add supplemental images highlighting details, scale, and usage
- Include product videos (boosts conversion rates 15-25%)
- Write benefit-focused descriptions emphasizing solutions, not just features
- Collect and display customer reviews on product pages
5: Monitor Performance by Segment
- Analyze performance by brand, category, price range, and margin level
- Identify and pause products with high spend but zero conversions
- Increase bids 20-40% on products with ROAS above target
- Use custom labels to identify seasonal opportunities and adjust bids
- Export search term reports and add negatives for irrelevant product queries
Display Ads Benchmarks 2026
Current Performance Metrics
| Metric | Average Range | Top Performers |
|---|---|---|
| Click-Through Rate (CTR) | 0.35% – 0.55% | 1.0% – 2.5% |
| Cost Per Click (CPC) | $0.50 – $1.20 | $0.25 – $0.65 |
| Conversion Rate | 0.7% – 1.2% | 2.5% – 4.5% |
| Cost Per Acquisition (CPA) | $45 – $120 | $20 – $50 |
| Viewable CPM (vCPM) | $2.80 – $6.50 | $1.50 – $3.20 |
Campaign Objective Variations:
- Brand awareness: CTR 0.25-0.40%, vCPM $3.50-$7.00
- Consideration: CTR 0.50-0.80%, CPA $35-$85
- Conversions: CTR 0.60-1.00%, CPA $40-$100
What Affects Display Ads Performance
Audience targeting precision drives 80% of performance variation. Remarketing audiences convert 5-10x better than cold prospecting.
Creative quality and relevance determines CTR. Display ads using dynamic content and personalization achieve 3-4x higher engagement than generic banners.
Placement selection impacts both cost and quality. Managed placements on premium publishers cost 40-60% more but deliver 2-3x higher conversion rates.
Frequency management prevents ad fatigue. Users seeing the same display ad 8+ times per week experience 50-70% CTR decline and develop banner blindness.
Common Display Ads Mistakes
Targeting everyone with prospecting campaigns burns budgets. Display works best for remarketing and highly specific in-market audiences, not mass reach.
Static image ads only miss engagement opportunities. Responsive display ads and HTML5 animations achieve 35-50% better CTR.
No frequency caps create negative brand impressions. Optimal frequency is 5-7 impressions per user per week; beyond that, performance craters.
Ignoring viewability metrics wastes impressions. Ads with below 50% viewability rates pay for impressions nobody sees.
Mixing awareness and conversion goals in the same campaign confuses the algorithm. Separate campaigns by objective for clearer optimization signals.
Display Ads Optimization Steps
1: Build Sophisticated Remarketing Funnels
- Create audience segments by engagement level: homepage visitors, product viewers, cart abandoners, past customers
- Develop specific messaging for each funnel stage (awareness vs. consideration vs. decision)
- Set higher bids for high-intent audiences (cart abandoners, repeat visitors)
- Use customer match to upload email lists and target existing customers with retention campaigns
- Build similar audiences from your best converters (but start with observation mode)
2: Creative Testing Framework
- Test at least 3-5 responsive display ads per ad group with different images, headlines, and CTAs
- Use dynamic remarketing to show previously viewed products automatically
- Create HTML5 animated ads highlighting key benefits and seasonal offers
- A/B test emotional appeals vs. rational benefits in ad copy
- Refresh creative every 4-6 weeks to combat ad fatigue
3: Advanced Targeting Combinations
- Layer demographics on top of in-market audiences (e.g., in-market for SUVs + household income $100K+)
- Combine affinity audiences with custom intent audiences based on keyword searches
- Use life events targeting for high-consideration purchases (new homeowners, new parents)
- Apply geo-targeting adjustments based on regional performance data
- Exclude converted users unless running retention campaigns
4: Placement and Format Optimization
- Review placement reports monthly and exclude sites with high bounce rates or zero conversions
- Add managed placements for premium publishers in your industry
- Test native ad formats alongside standard display for higher engagement
- Enable Gmail ads for B2B campaigns targeting professional audiences
- Use image extensions in responsive display ads for richer creative
5: Bid Strategy and Budget Management
- Start with Maximize Conversions for new campaigns to gather data
- Switch to Target CPA once you have 50+ conversions in 30 days
- Set frequency caps at 5-7 impressions per user per week
- Allocate 60-70% of budget to remarketing, 30-40% to prospecting
- Use dayparting to increase bids during high-conversion hours
YouTube Ads Benchmarks 2026
Current Performance Metrics
| Metric | Average Range | Top Performers |
|---|---|---|
| View Rate | 15% – 30% | 40% – 65% |
| Cost Per View (CPV) | $0.10 – $0.30 | $0.05 – $0.15 |
| Click-Through Rate (CTR) | 0.4% – 0.8% | 1.5% – 3.5% |
| Conversion Rate | 2.5% – 4.0% | 7% – 12% |
| Cost Per Acquisition (CPA) | $30 – $75 | $15 – $35 |
Ad Format Variations:
- Skippable in-stream: View Rate 20-35%, CPV $0.10-$0.25
- Non-skippable in-stream: CPM $8-$18, Completion Rate 95%+
- Video discovery ads: CTR 0.8-1.5%, CPC $0.30-$0.80
- Bumper ads: CPM $6-$12, Reach-focused
What Affects YouTube Ads Performance
First 5 seconds determine everything. 90% of skip decisions happen within this window. Ads that hook viewers immediately see 3-5x higher view rates.
Audience targeting specificity matters more on YouTube than any other platform. Custom intent audiences based on active search behavior outperform demographic targeting by 200-300%.
Video creative quality and relevance drives completion and action. User-generated style content with authentic testimonials converts 40-60% better than polished corporate videos.
Placement and content alignment affects brand safety and performance. Ads shown on relevant, brand-safe channels achieve 2-3x better engagement than run-of-network placement.
Common YouTube Ads Mistakes
Starting with a logo or slow introduction guarantees skips. Viewers decide in 3 seconds whether to watch or skip.
No clear call-to-action within the video wastes views. CTAs should appear verbally and visually at 5 seconds, mid-point, and end.
Targeting based only on demographics misses high-intent audiences. Search behavior and in-market signals predict conversion 10x better than age and gender.
Running one video creative indefinitely causes creative fatigue. Even great ads need refreshing every 6-8 weeks.
Ignoring watch time and engagement metrics focuses only on conversions. YouTube rewards engaging content with lower CPVs and better placement.
YouTube Ads Optimization Steps
1: Create Hook-Driven Video Content
- Lead with your strongest visual or statement in the first 3 seconds
- State the viewer benefit before the 5-second mark
- Use pattern interrupts: questions, surprising facts, bold statements
- Feature real people over animation for trust and relatability
- Keep skippable ads 30-90 seconds; non-skippable at exactly 15-20 seconds
2: Advanced Audience Targeting
- Build custom intent audiences from high-converting search keywords
- Layer affinity audiences with life events for life-stage marketing
- Create remarketing lists for video engagers (25%, 50%, 75%, 95% watch rates)
- Use customer match to target existing customers and lookalikes
- Combine placement targeting with audience targeting for precision
3: Call-to-Action Optimization
- Include verbal CTA at 5 seconds, 15 seconds, and end of video
- Add overlay CTAs linking directly to landing pages
- Use end screens with clickable elements to related content
- Create urgency with limited-time offers mentioned in the video
- Test different CTA types: “Learn more,” “Shop now,” “Get started,” “Sign up”
4: Testing and Creative Variation
- Run 3-5 video variants simultaneously to identify winners
- Test different hooks while keeping the body and CTA consistent
- Vary video length: test 15s, 30s, and 60s versions
- A/B testing emotional appeals vs. rational benefits
- Refresh top performers every 6-8 weeks with new angles
5: Campaign Structure and Bidding
- Separate campaigns for skippable vs. non-skippable formats
- Create remarketing campaigns with higher bids for engaged audiences
- Use Target CPA bidding for conversion-focused campaigns
- Set CPV bids manually for brand awareness campaigns
- Exclude irrelevant channels and apps through placement exclusions
- Monitor brand lift studies for awareness campaigns to prove incrementality
Performance Max Benchmarks 2026
Current Performance Metrics
| Metric | Average Range | Top Performers |
|---|---|---|
| Click-Through Rate (CTR) | 2.5% – 4.2% | 6% – 10% |
| Cost Per Click (CPC) | $0.90 – $2.80 | $0.50 – $1.50 |
| Conversion Rate | 5.5% – 8.0% | 12% – 18% |
| Cost Per Acquisition (CPA) | $28 – $70 | $15 – $35 |
| Return on Ad Spend (ROAS) | 350% – 550% | 700% – 1200% |
Business Type Variations:
- E-commerce: ROAS 400-600%, CPA $25-$55
- Lead generation: CPA $35-$80, Conversion Rate 6-9%
- Local services: CPA $40-$90, CTR 3.5-5.5%
What Affects Performance Max Performance
Asset quality and variety directly impacts reach and performance. Campaigns with 15+ high-quality images, 5+ videos, and 15 headlines achieve 40-60% better results than minimal setups.
Conversion tracking accuracy determines algorithm success. Performance Max lives and dies by conversion signals; inaccurate tracking creates garbage-in, garbage-out scenarios.
First-party audience data accelerates learning. Customer lists and website visitors provide the algorithm with proven conversion patterns to replicate.
Product feed quality (for retail) functions as the campaign foundation. Poor feed quality limits inventory visibility and wastes budget on low-intent placements.
Budget levels affect learning speed and stability. Performance Max needs sufficient budget ($50-100/day minimum) to gather meaningful signals across all channels.
Common Performance Max Mistakes
- Insufficient asset variety handicaps the AI. Providing 3 images and 5 headlines limits the algorithm’s ability to test and optimize across channels.
- No audience signals forces cold starts. Even though audience signals are “suggestions,” they dramatically improve initial performance and learning speed.
- Combining incompatible conversion goals confuses optimization. Don’t mix low-value lead form fills with high-value purchases in the same campaign.
- Premature campaign changes during learning phases disrupt optimization. Performance Max needs 2-4 weeks and 30+ conversions before major adjustments.
- No final URL expansion control sends traffic to irrelevant pages. Always review and manually add quality URLs rather than letting automation guess.
- Ignoring asset group segmentation treats all products or services identically. Create separate asset groups for different product categories or customer segments.
Performance Max Optimization Steps
1: Build Comprehensive Asset Libraries
- Upload 15-20 high-quality images: product shots, lifestyle images, close-ups, contextual scenes
- Create 5-7 video assets of varying lengths (6s, 15s, 30s, 60s)
- Write 15 unique headlines covering different benefits, features, and emotional appeals
- Develop 4-5 long descriptions and 4-5 short descriptions
- Include logo variations: square, landscape, and simplified versions
- Test different brand colors and visual styles across assets
2: Provide Strong Audience Signals
- Add customer match lists (existing customers, high-value customers)
- Include website visitor remarketing audiences (all visitors, category viewers, converters)
- Add custom segments based on relevant search terms and browsing behavior
- Include in-market audiences closely aligned with your offering
- Layer demographics that over-index in your conversion data
- Remember: These are signals, not restrictions, but they guide initial learning
3: Optimize Conversion Tracking and Goals
- Ensure all valuable conversion actions are tracked accurately
- Assign appropriate values to different conversion types
- Mark primary conversions separately from secondary actions
- Set up enhanced conversions for improved tracking accuracy
- Include offline conversion imports if applicable
- Adjust conversion goals based on business priorities (ROAS vs. CPA vs. volume)
4: Create Strategic Asset Groups
- Segment by product category for retail (Electronics, Apparel, Home Goods)
- Divide by service type for services (Premium vs. Standard offerings)
- Separate by customer intent level (High-intent vs. Awareness)
- Build geo-specific asset groups for local businesses
- Create seasonal asset groups with timely messaging
- Ensure each asset group has complete asset coverage
5: Monitor and Optimize Performance
- Review asset performance reports and remove or replace underperformers
- Analyze search category insights to understand where traffic comes from
- Check placement reports and exclude low-quality apps or sites
- Monitor auction insights to understand competitive landscape
- Adjust ROAS or CPA targets gradually (10-15% changes only)
- Allow 2-4 weeks between significant changes for algorithm re-learning
- Use experiments to test major changes before full implementation
6: Advanced Performance Max Tactics
- Run Standard Shopping campaigns alongside PMax with negatives to control brand traffic
- Create separate campaigns for different business objectives (acquisition vs. retention)
- Use brand exclusions to prevent cannibalizing high-performing Search campaigns
- Set up location-specific campaigns for businesses with multiple locations
- Test different bidding strategies: Target ROAS for e-commerce, Target CPA for leads
- Combine Performance Max with specialized campaigns (Search for brand terms, YouTube for awareness)
Cross-Campaign Strategy Insights
Budget Allocation Best Practices
For most businesses, optimal Google Ads budget distribution follows this pattern:
E-commerce:
- Search Ads: 25-35%
- Shopping/Performance Max: 40-50%
- Display/YouTube Remarketing: 15-20%
- YouTube Prospecting: 5-10%
Lead Generation:
- Search Ads: 50-60%
- Performance Max: 20-30%
- Display Remarketing: 10-15%
- YouTube: 5-10%
Brand Awareness:
- YouTube Ads: 40-50%
- Display Ads: 25-35%
- Performance Max: 15-20%
- Search Ads: 5-10%
Multi-Touch Attribution Considerations
Google’s data-driven attribution model shows Search and Shopping campaigns typically receive 30-40% credit for conversions they assist but don’t close. This means:
- Display and YouTube campaigns drive awareness that Search converts
- Remarketing campaigns significantly boost overall conversion rates
- Last-click attribution undervalues upper-funnel investments by 40-60%
Strategy implication: Don’t evaluate each campaign type in isolation. A holistic approach combining awareness (YouTube), consideration (Display), and conversion (Search/Shopping/Performance Max) outperforms single-channel strategies by 50-80%.
Seasonality and Timing Factors
Q4 (October-December): CPCs increase 30-50% across all campaign types due to holiday competition. Prepare by:
- Increasing budgets 40-60% to maintain impression share
- Launching remarketing campaigns 60-90 days before peak season
- Creating gift guides and holiday-specific landing pages
Q1 (January-March): CPCs drop 20-35% post-holidays. Capitalize by:
- Aggressive bidding while competition is low
- Testing new campaigns and creatives with cheaper traffic
- Building remarketing lists for future quarters
Industry-specific patterns:
- Tax services peak January-April (CPC increases 60-80%)
- Fitness peaks January and September (CPC up 40-50%)
- Travel peaks 60-90 days before peak season
- B2B slows 30-40% during summer and December
FAQ: Google Ads Benchmarks 2026
What is a good CTR for Google Ads?
A good CTR for Google Search Ads is 3-6%, while Display Ads should achieve 0.5-1%. Shopping Ads typically see 0.85-1.2% CTR, and YouTube ads should maintain 20-40% view rates. CTR varies significantly by industry, with legal services often exceeding 4% and retail averaging 2.5-3.5%.
What is the average CPC for Google Ads in 2026?
Average CPC in 2026 ranges from $1.50-$4.20 for Search Ads, $0.60-$1.40 for Shopping, $0.50-$1.20 for Display, and $0.10-$0.30 per view for YouTube. Industry makes a huge difference: legal services average $8-$15 per click while e-commerce sees $0.90-$2.50.
What is a good conversion rate for Google Ads?
Search Ads should achieve 4-6% conversion rates, Shopping Ads 1.8-2.5%, Display Ads 0.7-1.2%, and YouTube Ads 2.5-4%. Top performers in e-commerce often reach 8-12% on Search and 4-7% on Shopping campaigns. Conversion rate depends heavily on offer strength, landing page optimization quality, and traffic intent.
What is a good CPA for Google Ads?
A good CPA depends on your profit margins and customer lifetime value. Generally, Search Ads average $35-$85 CPA, Shopping $25-$60, Display $45-$120, and YouTube $30-$75. Your CPA is “good” if it’s 30-40% below your customer lifetime value or profit per sale, allowing room for overhead and profit.
How much should I spend on Google Ads per month?
Minimum effective spend is $1,500-$3,000/month ($50-100/day) to gather enough data for optimization. E-commerce businesses typically spend 8-15% of revenue on ads, while service businesses allocate 10-20% of revenue. Start with $50-100/day, then scale based on positive ROAS.
What is the difference between Performance Max and Shopping campaigns?
Performance Max uses automation across all Google channels (Search, Display, YouTube, Gmail, Maps) while Shopping campaigns focus only on Google Shopping results. Performance Max requires less manual management but offers less control. Many advertisers run both: Shopping for brand terms with high control, Performance Max for broader reach.
Why is my Google Ads CTR low?
Low CTR typically results from irrelevant keywords, weak ad copy, poor Quality Score, or strong competition. Fix this by tightening keyword relevance, adding negative keywords, writing benefit-focused ad copy with specific numbers and calls-to-action, and using all ad extensions. A CTR below 2% on Search Ads requires immediate attention.
How long does it take to see results from Google Ads?
Expect initial results within 7-14 days, but optimal performance takes 30-90 days. Google’s algorithm needs a “learning period” of 2-4 weeks and at least 30 conversions to optimize effectively. Don’t make major changes during the first 2 weeks. Performance Max campaigns particularly need 4-6 weeks to stabilize.
What is Quality Score and why does it matter?
Quality Score (1-10 rating) measures ad relevance, expected CTR, and landing page experience. Higher Quality Scores (8-10) reduce your CPC by 30-50% and improve ad position. Improve Quality Score by matching ad copy to keywords, creating relevant landing pages, and achieving high CTRs through compelling ads and exact match keywords.
Should I use broad match or exact match keywords?
Use both strategically. Exact match and phrase match provide control and high relevance (higher Quality Scores, better CTR). Broad match finds new opportunities but requires Smart Bidding and excellent conversion tracking to avoid waste. Best practice in 2026: Start exact/phrase match, add broad match once you have 30+ monthly conversions and Target CPA bidding enabled.
What is a good ROAS for Google Ads?
A good ROAS depends on profit margins. E-commerce with 40% margins needs 300-400% ROAS minimum to be profitable. Higher margin businesses (60%+ margins) can succeed with 200-250% ROAS. Top performers achieve 600-1200% ROAS through excellent targeting, landing page optimization, and conversion rate optimization. Your breakeven ROAS = 100 ÷ profit margin percentage.
How do I reduce my Google Ads CPA?
Lower CPA by improving Quality Score (better ad relevance, higher CTR), optimizing landing pages (faster load times, clearer CTAs), adding negative keywords weekly, using audience targeting to focus on high-intent users, testing ad copy variations, and switching to Smart Bidding strategies like Target CPA once you have sufficient conversion data. Most CPA reductions come from eliminating wasted clicks on irrelevant searches.
What’s the best bidding strategy for Google Ads in 2026?
Smart Bidding strategies (Target CPA, Target ROAS, Maximize Conversions) outperform manual bidding by 20-35% for accounts with 30+ monthly conversions. Start new campaigns with Maximize Conversions to gather data, then switch to Target CPA or Target ROAS after 30-50 conversions. Manual CPC still works for very small budgets or highly seasonal businesses with inconsistent volume.
What is the best campaign type for beginners?
Search Ads are best for beginners because they provide the most control, clearest data, and target high-intent users actively searching for your offering. Start with a single Search campaign focused on your best-selling products or services, use exact and phrase match keywords, and keep campaign structure simple. Avoid Performance Max initially until you understand conversion tracking and have baseline performance data.
Conclusion
Google Ads benchmarks provide guidance, but your performance depends on execution quality. Focus on improving Quality Score, testing landing pages, refining audience targeting, and giving Smart Bidding sufficient data to optimize. Accounts that systematically test, measure, and optimize outperform industry averages by 100-200% within 6-12 months.